
Systemic Data Quality Issues in Hungarian EU-SILC Income Data (2014–2023)
Our article is closely linked to two earlier pieces published on Válasz Online. In the article Researcher Concerns About the Reliability of EU-SILC Income Data in Hungary, Annamária Tátrai and András Gábos highlighted serious data issues in Hungary’s EU-SILC dataset—issues that affect key indicators used to track poverty both nationally and at the EU level. According to the authors, the nature and extent of the problems suggest not mere technical issues but a chain of professional errors, potentially even raising the question of data manipulation. Anita Élő’s piece Something Is Very Wrong with the HCSO’s Poverty Data expanded on these findings, placing them in the broader context of poverty research in Hungary.
In response, the Hungarian Central Statistical Office (HCSO) denied any allegations of manipulation. It attributed the anomalies to the structure of income distribution and offered the following clarifications.
- The Office is addressing income distribution issues as part of a routine revision, which runs parallel to a major revision — the latter focused on the reweighting of data based on the results of the 2022 census.
- Revised datasets for the 2019–2024 period will be submitted to Eurostat in the second quarter of 2025.
- The HCSO stated that “(…) the revision will not significantly alter the at-risk-of-poverty rate.”
In other words, according to the HCSO’s statement, neither the ongoing so-called “major revision” nor the “routine revision” is expected to substantially alter the previously published at-risk-of-poverty rates. We would like to express our concern that the revision described in the HCSO statement may not adequately address the gravity of the identified problems, nor does it appear to be planned with sufficient methodological rigor. From a professional standpoint, we find it problematic that the outcome of the revision is being pre-emptively downplayed. Based on our assessment, the scope and nature of the uncovered issues point to a likely underestimation of at-risk-of-poverty rates in the currently available data.
Since we first began raising these concerns in 2023, we have repeatedly called for dialogue with the HCSO. Most recently, on April 17, 2025, we addressed a letter to Áron Kincses, president of HCSO, requesting immediate consultation. We urged the office to share the principles and methods of the planned revision, along with details on data cleaning and imputation procedures. Such a consultation would allow the integration of knowledge accumulated by the research community and serve the only objective we as researchers have: the creation of high-quality datasets. Unfortunately, HCSO has not responded to our request and has shown no willingness to engage.
We are therefore making our latest findings public. In parallel, we will also share them directly with both HCSO and Eurostat. This article presents a shortened, public-facing version of our analysis. As before, our findings are based on an in-depth examination of the EU-SILC dataset—the source of Hungarian income data. Some of the issues have already been addressed in our earlier article published by Válasz Online on April 1, 2025. After briefly summarizing those findings, we introduce a new set of analyses conducted by members of the research community, following the article’s publication. These new results reveal further inconsistencies across the 2014–2023 period. We close this piece by offering a set of recommendations that we believe are essential for restoring trust in the data.
1. What did we claim in our previous article?
In our article published on Válasz Online on April 1, and in our response to the Hungarian Central Statistical Office’s statement issued on April 3, we made three key claims regarding the reliability of Hungarian income data.
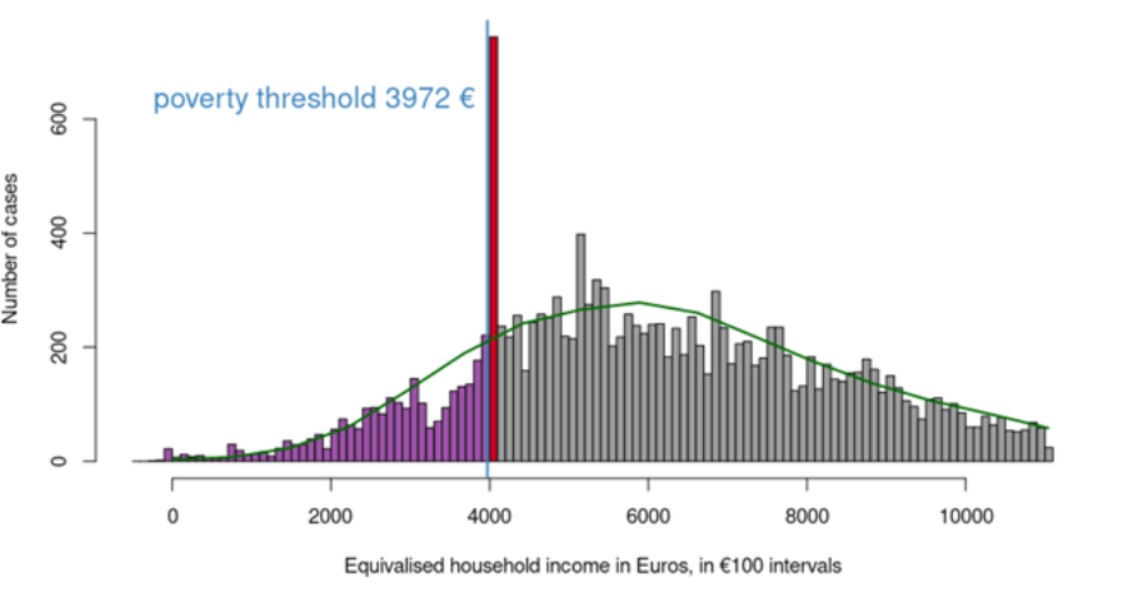
1. Since 2018, we have observed unusual spikes and clustering in the income distribution, mostly concentrated just above the poverty threshold. This pattern is not present in the data of other EU member states and is unlikely to have occurred naturally.
Note: An interactive visualization is available for the entire period from 2005 to 2023.
2. Our analysis suggests that these clusters likely emerged during the data cleaning and imputation phases. As a result, in multiple years, the at-risk-of-poverty rate in Hungary was likely underestimated. One striking anomaly is the unusually high number of identical income values after imputation. For example, in 2020, 316 single-person households were recorded with exactly the same annual income: €3,996.3110974. Such uniformity is statistically extremely unlikely.
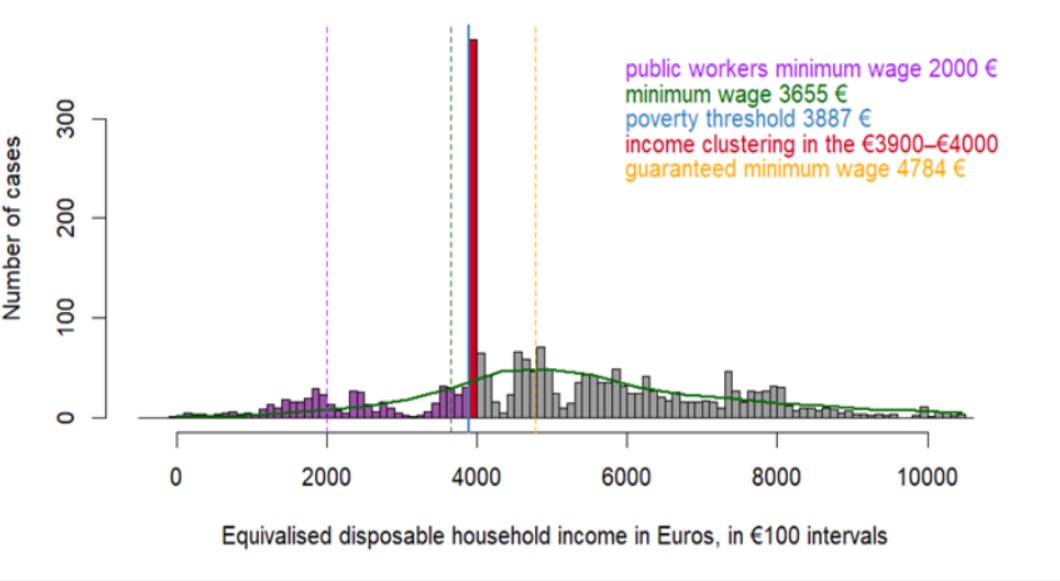
3. Contrary to the claim made in the HCSO’s official statement, these clusters cannot be explained by minimum wage thresholds, guaranteed wage minimums, or public work salaries. First, the observed income concentrations do not align with official administrative income levels for the corresponding years—even in the case of single-person households, which have simpler income structures. Second, income distributions are calculated based on the total annual equivalised household income. Even for single-person households, earned income is only one component of the total, making it highly unlikely that so many cases would fall within such a narrow income band. Yet this pattern was observed in Hungary between 2018 and 2021.
2. What are we claiming now?
Our main argument is that the EU-SILC income data portray a country that quite simply cannot be Hungary. Between 2014 and 2021, in 4% to 34% of surveyed households, the reported annual disposable household income exceeded the corresponding gross household income. According to these figures, 11% to 30% of individuals would not be paying taxes—they would be receiving them instead. This scenario is implausible given the structure of the Hungarian personal income tax and social security contribution system.
2.1. In 2020, 316 single-person households ended up with exactly the same income, because their differing gross incomes were adjusted by varying amounts of negative taxes and contributions—amounts that do not exist in the Hungarian tax system
The EU-SILC dataset contains detailed information on the incomes of individuals and their households, gained from various sources. These income components are aggregated into two main variables.
- The total gross household income variable sums up all gross personal incomes of household members (such as wages, pensions, unemployment benefits, or scholarships—if any household member receives such income), along with household-level gross income components (such as income from rental properties, family benefits, or transfers received from other households).
- The total disposable household income variable—often referred to for simplicity as net household income—sums up the same income components, but deducts the following:
- tax on income and social insurance contributions;
- taxes on wealth; and
- regular inter-household cash transfers paid.
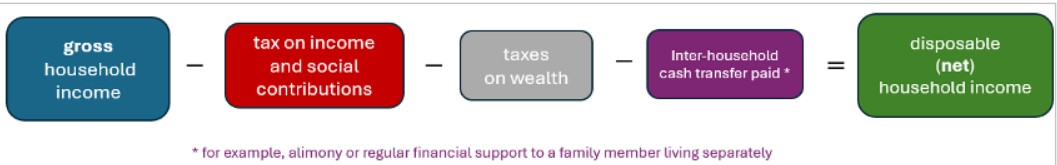
The total disposable household income provides information on how much income a household can actually use—how much they can truly spend. Indicators of income poverty and income inequality are based on this variable.
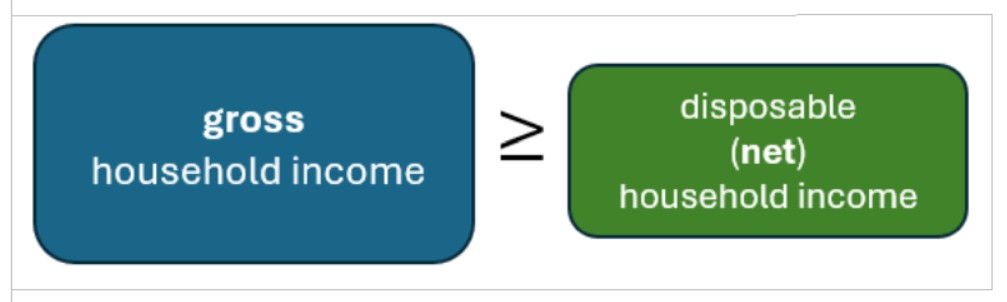
In Hungary, all components subtracted from gross income—namely taxes and contributions on income and wealth, as well as regular transfers to other households—can only take values of zero or above. (While some European countries allow tax refund mechanisms that may exceed the amount of tax paid, Hungary has never implemented such measures. We requested clarification from the National Tax and Customs Administration, which confirmed that such cases can only occur under highly exceptional circumstances in Hungary.) This means that by default the gross household income should always be greater than or equal to the disposable household income.
Note. This relationship should hold regardless of whether respondents reported their gross income, net income, or both in the survey. If any income value was not collected or the respondent did not provide an answer, the HCSO completes these data through imputation during the data cleaning process.
To present our new findings, we first examine the 2020 data of single-person households. As a reminder: in 2020, the annual incomes of 14% of single-person households—specifically 316 households—were exactly the same (€3,996.3110974). This amount exceeds the poverty threshold (€3,887) by €109.
A follow-up investigation conducted since our initial publication revealed that:
- The households with identical incomes consist exclusively of single elderly pensioners. All individuals concerned are aged between 57 and 81, all receive old-age pensions, 283 individuals (90%) had no income from employment at all, and 311 individuals (98%) earned less than 50,000 HUF (€154) annually from work. Thus, these households rely almost entirely on pension income.
- In 307 out of the 316 cases, the total gross income—which includes pension, gross wages, and occasional other revenues—is below the poverty threshold.
- These 307 households appear above the poverty threshold solely because their reported taxes and contributions are negative. In all these cases, the pension and total income values fall below the poverty threshold and vary by individual. However, their net income values are identical. In other words, the negative tax and contribution values artificially increased the calculated net income, resulting in figures higher than the actual incomes. Consequently, due to erroneous tax data, these households were classified as non-poor, although their gross income may place them among the poor.
The table below illustrates this situation with selected examples from the 316 single-person households sharing identical incomes, showing that this discrepancy occurs in 307 cases. It records annual incomes and regular payments, as well as the disposable (net) income, which should be compared to the poverty threshold of €3,887.
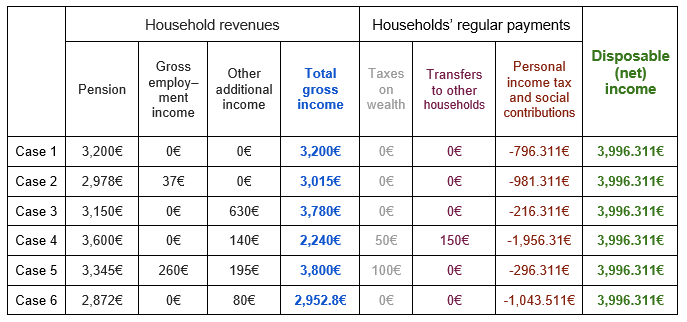
Based on our analysis, we find it highly unlikely that the income structures—illustrated here in 6 cases, and identically present in 307 instances in the EU-SILC database—could reflect real-world situations.
In the following section, we broaden our focus beyond the households with identical disposable (net) incomes and examine the income distribution of all single-person households in the years 2013 and 2020.
The figure below displays the bottom 50% of the income distribution among single-person households, ranked by their gross income in both 2013 and 2020. The dashed line represents the value of the poverty threshold for the respective year; individuals with a net income below this line are considered to be living at risk of income poverty.
Gross and disposable (net) equivalised income among individuals living in single-person households in Hungary, 2013 and 2020 (persons)
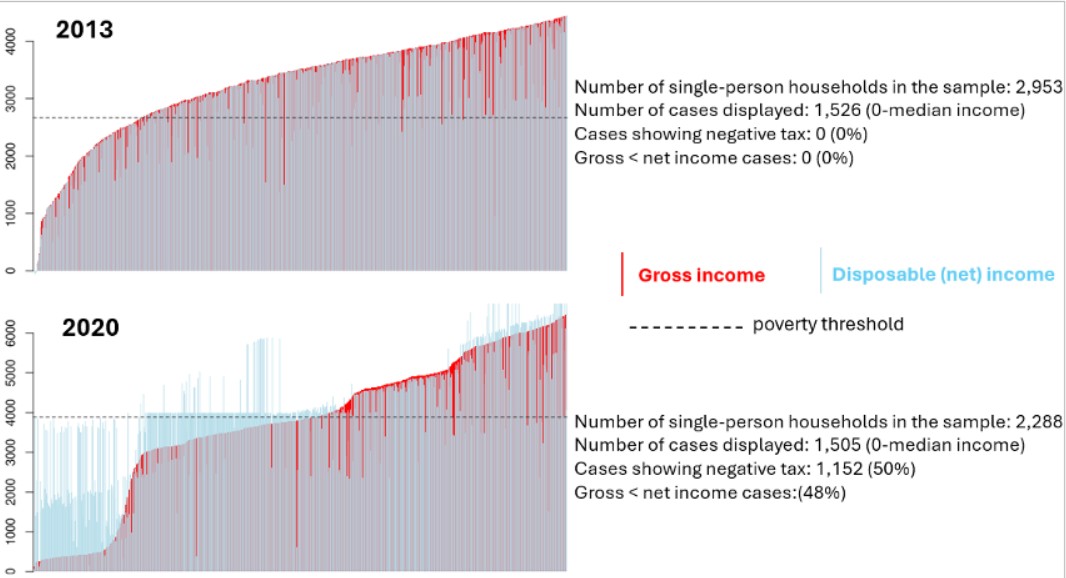
When examining the distribution, the following observations can be made:
- In 2013, there were no cases where the value of disposable (net) income (blue bar) exceeded that of gross income (red bar).
- In 2013, the ordered income values form a continuously increasing distribution, without the appearance of any „plateaus” caused by identical or near-identical values.
The 2013 distribution corresponds to the expected pattern of income distributions and aligns with what we would anticipate based on the structure of the Hungarian tax system and income composition.
- In contrast, in 2020, there are numerous cases where the disposable income exceeds the gross income, as illustrated by the blue bars on the chart.
- This is particularly common among individuals with gross incomes below the poverty threshold. In these cases, net income surpasses gross income, while the long, horizontal plateau just above the poverty threshold represents single-person households with nearly identical net incomes—typically €3,996.3110974—yet whose gross incomes vary and remain below the threshold.
In our view, these data cannot represent the actual income distribution of single-person households in Hungary in 2020.
An interactive version of the figure depicting the income distribution of single-person households in 2013 and 2020—allowing filtering across the entire 2005–2023 period as well as by household type (including the full sample)—is available at: https://tatraiannamaria.shinyapps.io/netgross/
2.2. The pattern observed in 2020 is not an isolated case—what we are facing is a more widespread and serious issue
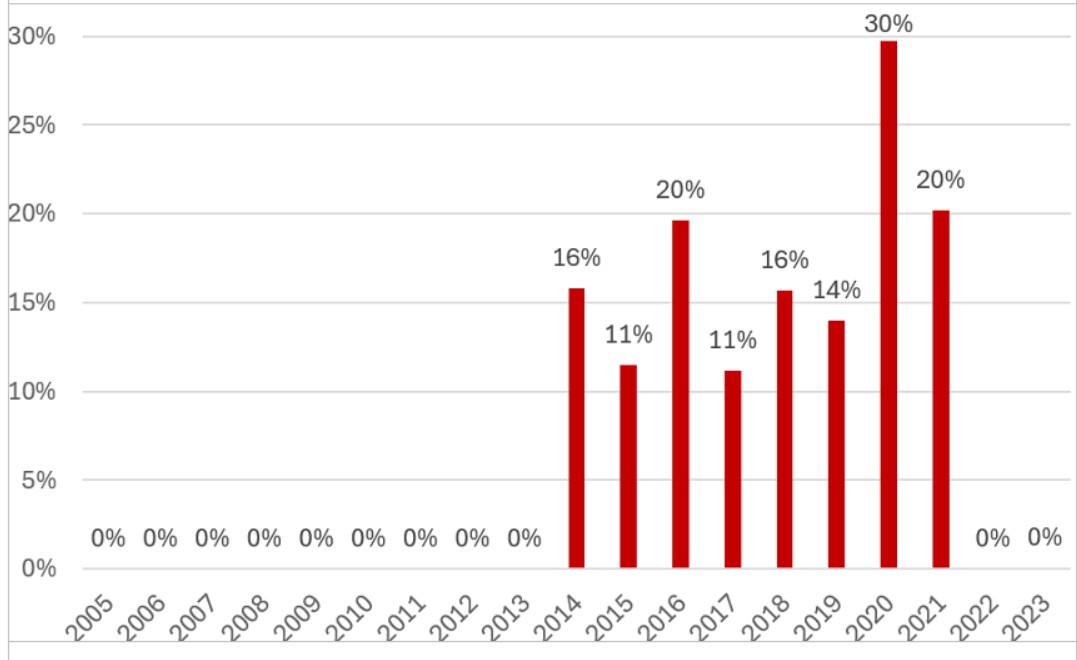
The phenomenon described for single-person households in 2020—wherein the disposable household income exceeds the gross household income in a substantial proportion of cases—is far from unique. Between 2014 and 2021, this anomaly appeared consistently and across multiple household types. As the figure below illustrates, during this period, official EU-SILC data indicate that in Hungary, between 4% and 34% of households had a gross income lower than their disposable income.
In contrast, before 2014 and after 2021, such discrepancies were either entirely absent or occurred so infrequently that their proportion was negligible compared to the total number of cases.
This discrepancy primarily stems from the fact that, during the same years, personal income tax and social security contributions frequently appear as negative values in the data. Between 2014 and 2021, 11% to 30% of individuals in the Hungarian EU-SILC sample were recorded as having negative payments—meaning they reportedly received more in tax and social security refunds than they had paid in. While there are countries where negative personal income tax burdens are a known and legitimate phenomenon (such as Belgium, Luxembourg, or Slovakia, where wage earners may receive cash benefits exceeding the amount of taxes paid), Hungary is not among them. Despite this, across all EU Member States and all available survey years between 2005 and 2023, the six most frequent occurrences of such cases were observed in Hungary, specifically in the years 2014 to 2021.
As previously noted, under the rules of the Hungarian tax system, such outcomes should only occur in highly exceptional cases.
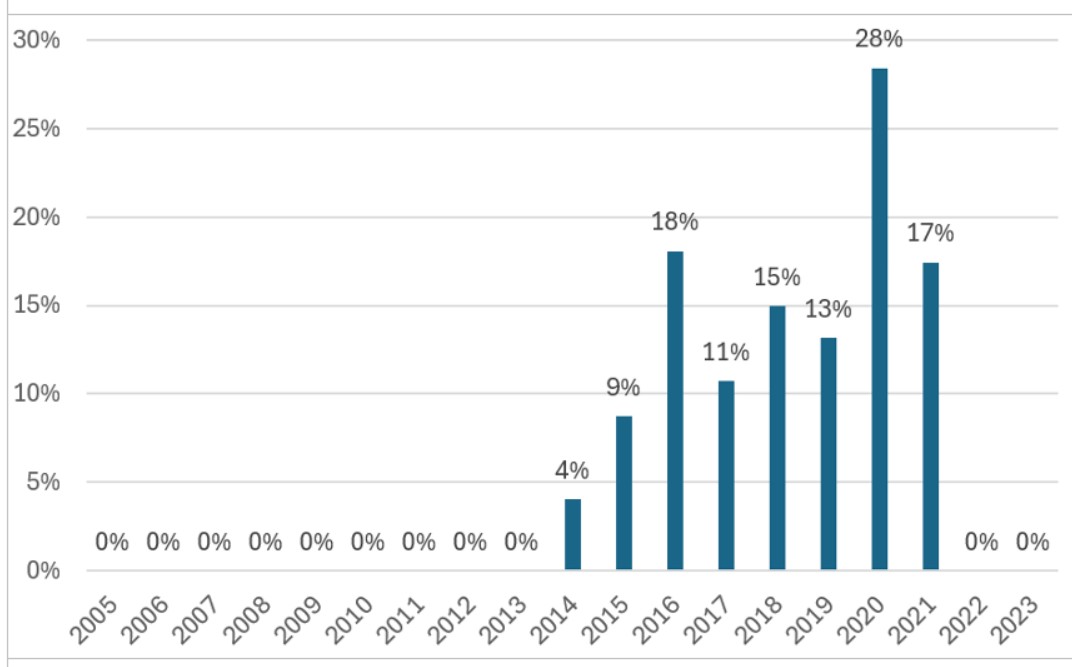
As a result of the previously described issues, a substantial number of cases emerge in which households are classified as being above the poverty threshold due to negative tax and social security contributions. In these instances, the household’s gross income falls below the poverty threshold, but their net (disposable) income appears above it.
These “threshold-crossing” cases—households that are statistically lifted out of poverty—constitute 1% to 9% of the full sample between 2014 and 2021. It is highly likely that these individuals only appear to be above the poverty line because HCSO attributed tax and contribution refunds to them that could not occur according to the Hungarian regulation.
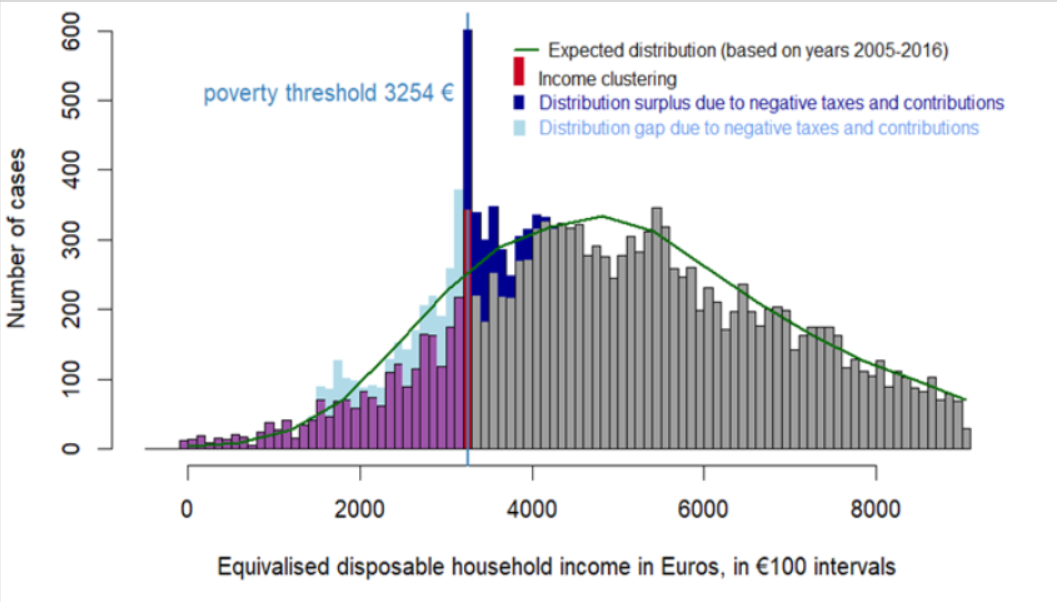
This phenomenon is illustrated in the figure below, where:
- Purple bars represent individuals who are classified as living in poverty according to EU-SILC data, and whose reported income tax is zero or positive. In their case, the „threshold-crossing” phenomenon caused by negative tax and social security contributions does not occur.
- Grey bars indicate those living above the poverty threshold, who are also unaffected by this issue.
- The light blue and dark blue bars show how the income distribution changes depending on whether negative tax and contribution values are taken into account. The dark blue segments reflect the situation including negative taxes and contributions, while the light blue segments show the distribution excluding these values.
The light blue areas thus represent cases with incomes originally below the poverty threshold, which appear to cross above the threshold only because of the negative tax and social contribution values—depicted by the dark blue area. These “threshold-crossing” cases account for 21% of one-person households in 2020 and 5% of the full sample in 2018.
2.3. Additional issues in the income data
In addition to the problems discussed so far, our analysis has revealed further issues of a different nature. The at-risk-of-poverty gap—that is, the distance between the incomes of those in poverty and the poverty threshold—shows exceptionally high volatility in Hungary between 2017 and 2024, especially among children. This volatility stands out in an EU comparison and was not observed in earlier periods.
The year 2023 in particular is marked by multiple, interrelated anomalies in the lower end of the income distribution. These distortions render the data for this year—which have already been published by HCSO as the 2022 data point and included in the Eurostat database—outliers. In this year, we simultaneously observe:
- Exceptionally low income levels among people at risk of poverty;
- Exceptionally high poverty gap values, particularly among children;
- Unusual concentrations of certain household types or age groups in specific segments of the income distribution.
These extreme values—both relative to the preceding and following years—cannot be explained by actual social or policy changes and must therefore be attributed to data quality issues. We have provided a detailed discussion of these concerns in a memorandum submitted to both HCSO and Eurostat, concurrently with this paper. The memo is publicly available to interested researchers via ResearchGate.
3. Summary and recommendations
Our research has uncovered numerous significant issues in the Hungarian income data from the EU-SILC survey, which have undermined trust in the reliability and usability of these data. This concern extends not only to domestic users, but also to international researchers, institutions, and policymakers across Europe and beyond who rely on Hungarian income indicators for their publications or policy decisions.
We therefore consider it essential to restore confidence in the integrity of these data. Until that is achieved, users must be clearly informed about data quality issues and provided with practical guidance for responsible use. We propose the following:
- All Hungarian income-based indicators for the post-2013 period that contain evident data errors should be either removed from the HCSO and Eurostat databases and publications or explicitly marked as “under revision.” In addition, EU-SILC microdata releases should include a clear notice about the revision process and its content, along with recommended disclaimer text for publications that make use of Hungarian microdata.
- A professional dialogue should begin between HCSO staff responsible for EU-SILC and data users before June 30, 2025, during the revision period indicated by HCSO. The aim should be to extend the revision process beyond reweighting based on the 2022 census and to address income-related data quality issues for the entire 2014–2024 period. We also reiterate our earlier proposal that this expert dialogue should be hosted by a trusted, independent academic or professional institution, separate from HCSO.
- As part of the revision process, the methods and procedures used for weighting, income validation and cleaning, and the imputation of missing values should be made publicly accessible, as transparency is a prerequisite for meaningful professional dialogue.
Annamária Tátrai, ELTE Faculty of Social Sciences, Statistical Department
Gábos András, TÁRKI
Huszár Ákos, HUN-REN Centre for Social Sciences
Krekó Judit, Budapest Institute, HUN-REN Centre for Economic and Regional Studies
Tomka Zsófia, TÁRKI
All codes used in our analysis are available at: https://github.com/AnnamariaTatrai/EUSILC_HU_reliability2


