
Something Is Very Wrong with the HCSO’s Poverty Data
„There’s no way the HCSO’s income poverty data could have developed this way naturally,” commented Zsolt Németh, former Deputy President of the Hungarian Central Statistical Office (HCSO), in response to the academic analysis published alongside our article by Annamária Tátrai and András Gábos. Their study shows that the HCSO has been publishing poverty data for years that raise the possibility of professional error or even manipulation. According to the statistician who held a senior position at the HCSO between 2010 and 2017, the probability of so many people having incomes just above the poverty line is practically zero. Our article tells the story of how an assistant professor at ELTE and a senior researcher at TÁRKI discovered that something strange was happening with the poverty data: a large number of people had suddenly crossed the poverty line and landed just above it. As a result, they were no longer counted as poor in EU or national statistics – and, of course, in political discourse. This is the story of the rise and fall of Hungarian poverty statistics.

Chapter 1: When UN Researchers on Child Poverty Are Puzzled — and Their Hungarian Colleagues Slap Their Foreheads
The story became apparent after the war against Ukraine began. Researchers at UNICEF, the Florence-based United Nations agency that focuses on child poverty, believed that children could be among the biggest losers in the wave of inflation sweeping across Europe. In the summer of 2023, the researchers produced a unique study based on a fictional scenario: they took food and energy prices from previous years, multiplied them by inflation rates, and examined how the devaluation of money would affect families with children. Their goal was to estimate how much child poverty would increase.
They carried out the calculations for each country — but they got stuck when it came to Hungary. They noticed that the incomes of many families with children were clustered just above the poverty line. Or, to be more precise, the incomes of a very, very large number of families were.
The UNICEF researchers couldn’t make sense of the situation, and since they had previously worked with them professionally, they turned to TÁRKI staff — including senior researcher András Gábos — for clarification.
„Could it be that there was some kind of government measure that could explain this phenomenon?” they asked. After all, it was entirely plausible that the government, in response to the inflation crisis, might have introduced an income supplement for the poor, pushing many just above the poverty line.
But the Hungarian experts knew full well that no such government action had taken place to justify the anomaly. Social assistance and family allowances have remained unchanged since 2008. UNICEF’s puzzle began to spark the imagination of the Hungarian researchers. It turned out that this wasn’t so much a new question as it was an answer to many of their earlier suspicions. This wasn’t the first sign that something was wrong with Hungary’s poverty data.
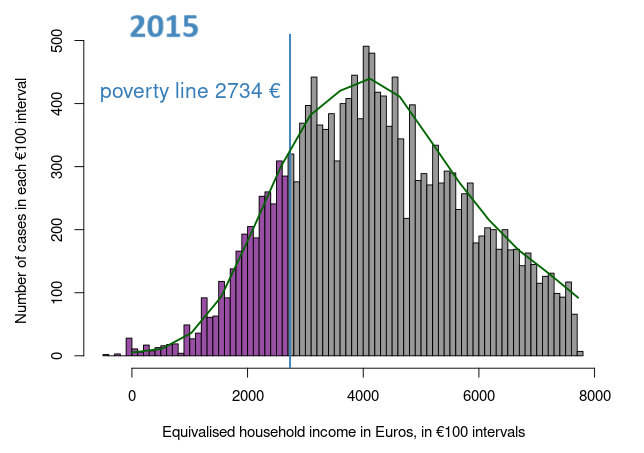
András Gábos brought in Annamária Tátrai, a statistician from ELTE, to help with the research. They pulled income data for Hungarian children from the Eurostat database — the statistical office of the European Union — and plotted the figures. They created a bar for every 100 euros and expected to see a curve resembling a small hill: steeply rising at first, then gradually sloping down.
In other words, they expected that there would be relatively few very poor people at the start of the “climb,” and even fewer wealthy people at the end of the “descent.” The top of the “hill” would be the highest, with the majority of people in the middle-income category. This is exactly what the graphof the Hungarian data looks like from 2005 to 2015.
The international data followed this expected shape, but the Hungarian chart from 2018 onwards looked nothing like it. It was as if an observation tower had been built on top of the hill — or rather, a very tall tower.
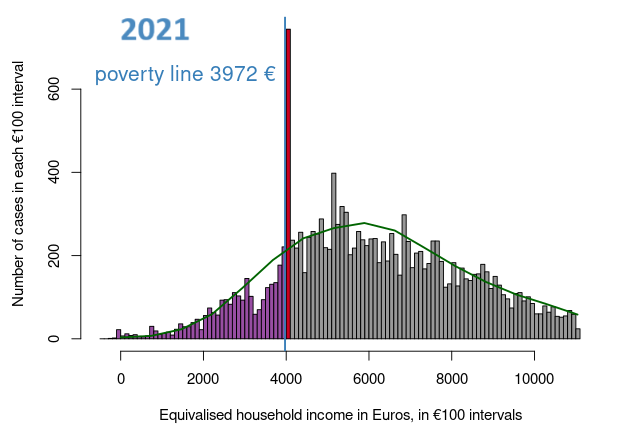
An unusually large number of people had exactly the same income, and this strange clustering occurred in several years precisely in the 100-euro band just above the poverty line — where the data suddenly spiked, forming tower-like peaks. In their earlier research, the researchers had not drawn such curves (or histograms, in scientific terms), but their research over the past two years were based on exactly these.
First, they looked at data for children, going all the way back to 2005. The earlier Hungarian charts also had a hill-shaped distribution, but things started to shift in the second half of the 2010s. Starting in 2018, the values just after the blue line, which indicates the poverty line, suddenly shot up like towers.
Later, they visualized the data for the entire population and saw the same “tower” appear in the curves for 2018, 2019, and 2020. They then created graphs for single-person households — and the strange formation appeared there as well, and persisted through 2022.
So, starting in 2018, the numbers seemed to have gone haywire, but only in Hungary. At the same time as the curves „rebelled,” the HCSO began reporting poverty data that improved at an astonishing rate.
Between 2015 and 2020, the child poverty rate in Hungary fell by 63 percent. Not a single researcher disputed the process, because at the same time employment increased significantly, which could have led to the decline in poverty. The magnitude of the decline seemed surprising.
It is hard to imagine how the number of children living in poverty could be halved while the pressure on social services has barely decreased and the number of disadvantaged and multiply disadvantaged children has declined much less.
How is this possible? Hungarian researchers contacted the HCSO, but the HCSO did not consider the phenomenon problematic. Our newspaper also sent questions to the Statistical Office, but by the time of publication, we had not received a reply. (We will update the article as soon as we do.)
Annamária Tátrai turned to the opponent of her doctoral dissertation, Zsolt Németh — former deputy president of HCSO, who worked at the office for 36 years, especially in the field of social statistics. Few people know the methodology of the HCSO and Eurostat better than he does. They hoped the statistician would provide answers to their questions. And he did. He said that what appears in Annamária Tátrai’s graphs could not occur naturally.
But he also said something else: This was not the first time he had heard about this problem. There had been signs before.
Chapter 2: Elected for Six Years, Dismissed After Six Months
Zsolt Németh had an exceptional career at HCSO. In 2010, he became vice president of HCSO, and in 2016, Viktor Orbán extended his appointment for another six years. It was an important position, as the HCSO is a national cornerstone institution—without reliable data, it is impossible to implement sound economic or social policies. However, his second six-year term came to an abrupt end in just over half a year. In 2017, he came under considerable pressure to resign. From that year on, he supported the work of the HCSO as a presidential advisor, and in 2018 he had to relocate to aHCSO unit at Pécs.

Zsolt Németh, chief advisor to the HCSO president, gave a presentation at the conference celebrating the 150th anniversary of the HCSO on May 25, 2017 (source: KSH).
Zsolt Németh clearly remembers when young researchers first drew his attention to a strange phenomenon: something was wrong with the poverty data. According to his recollection, the first such signal came around 2017.
Chapter 3: A politically sensitive issue – who is considered poor?
To understand the facts, it is important to establish what income poverty is. We don’t want to go into technical details, but it is easy to see that someone who is considered poor in Luxembourg, Austria or Belgium could be considered middle class in our country. Poverty is a relative concept, which is why the EU has developed a common methodology for measuring it. The national statistical offices select a few thousand families and regularly ask each member of the family – in our case up to 30,000 people – about their income, then calculate the average income per household member and send it to Eurostat (the exact methodology can be found in the scientific article by the Tátrai and Gábos). Finally, they are ranked in order: the poorest first, the richest last.
The person in the middle is the one whose income is most important for us, the so-called median income. The reason we bother with this is that if a few top earners and a multi-billionaire were accidentally included in the sample, the average income would rise to many millions of forints, while in reality a small pensioner would still receive a fraction of this, 110 thousand forints.
So, of those in the queue, they take the middle 60 per cent of their income and draw a line there (we have marked this in blue in our figures above), this is the relative income poverty line. Those above it are not poor, those below it are.
Each year, they report the percentage of those who are above the line. This is the poverty index (officially known as the relative income poverty rate.) The figure is published every year and is politically important because it can be used to monitor the performance of governments. One indicator of good governance is whether the proportion of poor people is falling compared to previous years.
Until 2016-17, the opposition used the indicator heavily, because in the first third of the decade – due to the lingering social effects of the 2008-2009 global crisis – they had increasingly worsening indicators. After 2017, however, they were silenced because they could only praise the government, and they did not want to. Poverty was thus removed from the hottest political debates.
After 2017, the share of poor people improved dramatically. From a low of 14.8 percent in 2015, the numbers improved to an all-time high of 12.1 percent in 2022. (By all times, we mean since Hungary joined the EU.)
Perhaps it improved too well. But until UNICEF’s research, no one had looked at the distribution of income behind the ratio, and only after the Florence researchers’ questioning did a growing number of domestic sociologists and statisticians realize what they were seeing. A real Hungaricum. It is unusual, to put it mildly, for a tower to rise above the poverty line and for the curve in front of it to look as if a few pieces had been cut out of it.
– In 2020, we found 316 single-person households with an income in euros equal to seven decimal places. So it’s the same to the nearest ten millionth! Needless to say, it’s not a coincidence that 14% of single-person households have an income of just €3996.3110974. And that’s what happened here – illustrates Annamária Tátrai.
- Everyone over the age of 16 is interviewed in the household. A lot of information is collected: for example, whether they have a job, how much they earn there, whether they have worked overtime, whether they have received benefits, whether they produce anything at home, whether they receive money regularly from relatives or distant family members. It is easy to see: it is not possible for the data to match en masse. Unless UNICEF has an idea, this phenomenon would have never appeared, because in a sea of tens of thousands of data, these outliers are invisible. The curves showed it, says András Gábos.
- There is not just a little dirt in the data, the problem is much more serious. It’s all a blur”, says the former Deputy President of the HCSO.
As journalists, it is our job to doubt that the minimum wage is the cause of accumulation. So we asked Annamária Tátrai to collect data on single-person households and plot the minimum wage on the graph to see if it caused the peaks. No, the „tower” and the minimum wage are not the same, even for single-person households.
Chapter 4: Except for Hungary, due to unreliable data
The UNICEF researchers were not reassured by the responses of their Hungarian colleagues, and the graphs showed even more clearly that there was a problem with the data. The UNICEF study was eventually published with a note in the appendix stating that the study included data from all EU countries except Hungary. Due to problems with the reliability of the data, UNICEF did not publish the Hungarian results.
Meanwhile, the government has met both EU targets for 2030: employment has increased, and poverty has decreased. However, HCSO has not corrected the data that the researchers found problematic.
Instead, strange signs emerged. Annamária Tátrai verified the UNICEF data by creating histograms based on data requested from Eurostat and available in the Safe Center of the HCSO.
- I found the same thing in the HCSO Safe Center. The tower of outliers was there, just above the poverty line from 2018. Right behind it. But the real surprise came when I was told that neither the graphs nor the calculations could be taken out of the Safe Center. They cited data protection reasons,” says Annamária Tátrai.
She was not researching nuclear secrets, but data on poverty. Why should it be secret? It would be understandable if you could find out the net income of the widowed István Kovács on Darukezelő Street in Érd by poking at a point on the graph. But for no point on the graph can it be determined whose income it is. Why should a sociologist conduct research on poverty rates if she cannot publish the results?
– „I have never seen anything like this before, it is completely beyond my comprehension” – said Annamária Tátrai.
It is not only incomprehensible, but also pointless, since the exact same data can be accessed directly at Eurostat. It took a few months for Annamaria to obtain the European research license and produce the figures that are now public. These also show the towers, for several years above the poverty line, but sometimes just above it or a shade below it.
The layman and the professor of statistics see exactly the same thing in these graphs: a strange growth at the most politically sensitive point. Two academic conferences have already publicly discussed the issue, including whether the UNICEF, TÁRKI and ELTE researchers might have made a mistake in their calculations. They concluded that no, the histograms were scientifically sound.
Chapter 5: Disappearing poverty
It is strange that some columns above the blue poverty line reached the sky from 2018 to 2021, while some columns were missing below the blue line, for example in 2021. There are no examples of similar „disappearing columns” in the international data on poverty.
It is scary, really – sums up Zsolt Nemeth. It is not only absurd that the values are so high above the poverty line, but also that some columns are almost missing. And just below the line. According to the rules of statistical distribution, it should not be the case in a sample of thousands or even tens of thousands that some income bands are almost completely empty. As we do not see examples of this in any other EU countries – he explains.
All this is important because it can show how the mistake could have happened.
– From what we know about poverty in general, we conclude that something has happened to the income data of those below and just above the poverty threshold. Those below the poverty line are very few, those above are strikingly numerous. There is zero probability that the data would have this kind of dispersion without manipulation.
Theoretically this could be an individual, random mistake, but then the statistical office would have corrected it when it was first noticed. If the mistake was not unintentional then the numbers suggest an attitude similar to that of Duffy Duck from the professionals at the statistical office – says the former vice-president of the statistical office.
The journalist is still puzzled, of course. If they accidentally or intentionally inflate their income before the poverty line, so they are not poor anymore, doesn’t that move the whole thing? Doesn’t it move the poverty line up, doesn’t it raise the 60 percent of the median? Doesn’t it collapse like a house of cards?
– No, explains Annamária Tátrai, -In the case of median income, the middle value is what matters. So if the number of people is the same before and after it, the median does not move. Its value remains the same no matter what happens around the blue line. So the proportion of people living in income poverty can change significantly without the median moving,” the statistician simplifies the story.
The researchers we asked agree that this is not a normal phenomenon.
– We have contacted the HCSO in several rounds, but we have not received a substantive response – says András Gábos.
– We decided that we needed to step out of the professional community and raise public concerns about the data. Since 2017 the data problems have been so large that they have made national income and poverty research impossible,” adds Annamária Tátrai.
Chapter 6: The Poor on a Diet
They were not the only ones who found that something was off with the poverty-related data published by the Hungarian Central Statistical Office (HCSO).
Ákos Huszár pointed out in the 2022 volume of Társadalmi Riport that in 2015, 9 percent of households—and in 2019, 13 percent of the sample, meaning every eighth household—reported a net income higher than their gross income. He found no similar occurrences in previous HCSO databases. And for good reason: such a situation would imply that some people in Hungary do not pay taxes but receive them—that is, after taxes, they take home more than the gross amount listed on their payslip.
This is clearly impossible, and yet the HCSO data suggest otherwise. At our request, researchers extended the data series and found that by 2020, this phenomenon applied to 28 percent of the sample.
Today, when poverty is less frequently discussed in the political arena, it is difficult to understand why the HCSO would commit to such a position, why it would not check the figures and correct them if an error occurred. Yet in the 2010s, poverty was one of the hot topics in high-level politics in Hungary. Just think back to the calculations of the subsistence level, and how uncomfortable it became for the government when millions of people failed to reach the threshold regularly reported by HCSO.
At that time, the HCSO first suspended its previous practice of calculating the subsistence minimum, and in 2015 published a working paper with proposals for revising the methodology. The publication only indicated that it was produced by the Department of Lifestyle, Employment, and Education Statistics at the HCSO. At the time, his department was headed by Katalin Janák, while Áron Kincses, thecurrent the President of HCSO, was responsible for the poverty-related data.
The anonymous authors proposed that the HCSO change the methodology used to calculate the minimum nutritional requirement related to the subsistence minimum. One of the proposed new methods would reducethe daily caloric requirement from 2,400 calories to 1,800 calories. This would override the previous nutritional science recommendation that people who engage in light physical activity need 2,300–2,500 calories per day, depending on body weight. The poor often work in physically demanding yet poorly paid jobs, but a lower calorie requirement would also lower the minimum subsistence level. Ákos Huszár, an employee of the department, expressed his disagreement with the proposed changes in an academic article, noting that the proposals raise „serious substantive and methodological concerns”.
In the end, the HCSO cut the Gordian knot and stopped calculating the subsistence minimum. For reasons of conscience, Ákos Huszár first requested a transfer to another department, and shortly thereafter he became one of the many researchers who left the HCSO.
Meanwhile, Áron Kincses’s career took off. In 2016, he was still the head of the HCSO’s Department of Lifestyle Statistics, the department that conducted the poverty-related studies discussed in this article. From 2017, he became deputy president, and by 2023, he had earned his Doctor of Science degree from the Hungarian Academy of Sciences and was appointed president of the HCSO.
Over time, inflation has replaced poverty data as one of the hottest political issues.
In a uniquely Hungarian twist, the HCSO has recently been reporting different inflation figures to Eurostat than to the Hungarian public. Since last October, they have consistently published domestic inflation rates that are 0.2 percentage points lower than the figures submitted to Eurostat. In February, the difference was 0.1 percentage points – due to the use of different calculation methods.
Chapter 7: A Little Correction?
Meanwhile, poverty has fallen out of the political spotlight. Political opponents could no longer use it as a tool to pressure the government, and very few people outside of researchers are interested in poverty data. Inside the HCSO, however, there were already signs of of concern in 2017. From 2022, researchers from other institutes also began to point out strange phenomena, and by 2023, international feedback indicated that there were problems with the relative income poverty data.
The researchers informed Eurostat about the error they had found, and that was the first signal that something might be wrong. András Gábos received a response saying that the databases were under revision, and that the corrected data would probably be sent to Eurostat by May.
However, the latest data are not without contradictions, but it seems that what is happening now is the opposite of what we saw around 2017. The figures, which had been steadily improving until 2022, began to worsen in 2023. Not just declining but actually plummeting.
There is undoubtedly a crisis, but does it justify a 9-year low in the poverty index? For child poverty to almost double?
Should the pensioner poverty rate, which is still 14.7% in 2022, rise to 24.2% last year? Should the poverty rate for retirees who no longer have adult children living with them or who were childless, rise from 17.4 percent in 2022 to more than 30 percent in two years?
– The crisis is more severe in Hungary than in other EU countries, so it’s not surprising to see a reversal in the poverty figures,” says András Gábos. „But the rate of deterioration in some groups is so significant that it again raises questions about reliability.”
– There is a kind of slippage in society, an increase in income poverty, but this does not justify this scale and this increase,” said Zsolt Németh.
„I find what has happened truly disappointing”, says Annamária Tátrai, „As poverty researchers, we can only rely on the data of the Hungarian Statistical Office and Eurostat, and it is crucial that these data are credible. We have written this article with András Gábos to raise public awareness of this issue. Our confidence in the reliability of Hungarian income data since 2017 has been shaken. We want poverty to be measured according to EU guidelines and professional rules, because clarity is in everyone’s interest.
After the publication of our article, the HCSO sent us the following statement.
Note: The years next to the data are given according to Eurostat methodology.


